Online Reaction Test How Quick Are You
So you just finished your first online reaction test and a number in milliseconds is staring back at you. Maybe it says 280, maybe 340. The obvious question — is that quick? — turns out to have a less obvious answer, because a reaction time score only means something once you know what produced it.
Overview
So you just finished your first online reaction test and a number in milliseconds is staring back at you. Maybe it says 280, maybe 340. The obvious question — is that quick? — turns out to have a less obvious answer, because a reaction time score only means something once you know what produced it.
This guide is written for people holding that first score. We run the free reaction time test on Best Reaction Test, and what follows is how to read your result the way a careful practitioner would: what typical online ranges look like, why your first session overstates or understates your real level, which factors move the number, and what is worth doing next.
What Your Score Actually Measures
In a simple visual reaction test, you wait for a color change and click the moment you see it. The reported number is the gap between the signal appearing on your screen and your click registering. That sounds like pure biology, but it is not: the measurement also includes your display's refresh delay, your mouse or touchscreen, and your browser's processing overhead.
A standard 60 Hz screen redraws roughly every 16.7 milliseconds, so the signal can sit unshown for up to a full frame before your eyes ever get it. Input hardware adds a little more. Every online score is therefore your nervous system plus your setup — which is why a browser result should never be read as a lab-grade measurement of your reflexes.
What Typical Online Ranges Look Like
Published numbers vary widely because every protocol measures differently, and that spread is itself the first lesson in interpretation. A few reference points from the research literature:
- A calibrated laboratory study by Woods and colleagues reported a mean simple visual reaction time of about 231 ms across 1,469 adults — measured with dedicated hardware, not a browser.
- A large computerized study by Vincent and colleagues, covering more than 107,000 participants, came in at 261 ms.
- A different computer protocol used by Deary and Der produced 328 ms in 1,930 adults.
- A web-based sample of 10,060 participants — the setup closest to what you just used — reported a median of 301 ms and a mean near 318 ms.
Notice the pattern: the closer the method gets to an ordinary browser on ordinary hardware, the higher the number climbs. The web sample's median of 301 ms is the most honest comparison point for an online score, not the lab's 231 ms. If your first result sits somewhere in the 250–350 ms region, you are in very ordinary company for an online test.
Age shifts these figures, but gently. In the Woods data, observed means rose gradually from roughly 218 ms in the youngest adult group to about 239 ms in the oldest, and Wilkinson and Allison found a similar decade-by-decade drift across 5,325 participants. We break these reference numbers down further on our average reaction time page. Treat all of them as rough orientation, not diagnosis — there is no single universal average human reaction time.
Skip the guesswork — measure it
Reading about reaction time only gets you so far. The five-round test takes about a minute and gives you a median score you can actually track.
Take the reaction time testWhy Your First Session Is Not Your Real Level
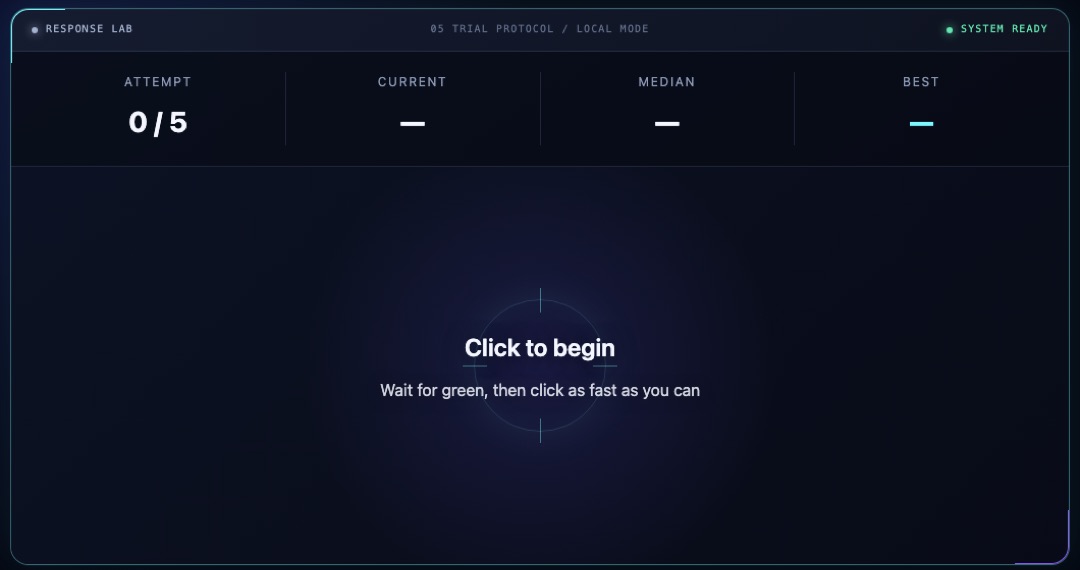
Running this site, we notice one pattern more than any other: a person's first round is almost always their slowest. Part of that round is spent learning the task itself — what the signal looks like, how the random delay feels, how much tension to hold in your clicking hand. Only after a few rounds does the number start reflecting your response speed rather than your unfamiliarity.
This is exactly why our test runs five rounds and reports the median instead of your best or your first attempt. A single round mixes genuine reaction with task learning, lucky guesses, and fumbles; the middle value of a short series filters much of that noise out. You can read the reasoning in full on our methodology page.
The opposite distortion shows up later. After a dozen or more back-to-back rounds, most people find their attention starts to drift and their times creep upward again. Your truest reading lives in the settled middle of a session — not the nervous first click, and not the thirtieth round you ground out while half-bored.
What Moves the Number
Once you accept that a score is a snapshot, the next step is knowing what the camera was pointing at. Several everyday factors shift an online result by far more than raw talent does:
- Sleep and fatigue — cumulative sleep restriction has been shown to degrade sustained attention and cognitive performance in a dose-dependent way (Van Dongen et al., 2003), and test late at night and you'll likely see it in your own medians.
- Distraction — notifications, background video, and conversation all tax the same attention the test is measuring.
- Familiarity — early rounds carry a learning cost that inflates your average.
- Anticipation — with repetition you may start predicting the signal. Scores under roughly 100 ms on a browser test indicate anticipation rather than reaction, since the display and input pipeline alone eats more time than that.
- Practice background — research on action video game players found they respond faster without sacrificing accuracy (Dye, Green & Bavelier, 2009), so gaming history quietly shapes baselines.
None of these factors is a verdict on your reflexes. They are context — and context is why the same person can post noticeably different scores on different days without anything about their biology changing.
Reading Your Own Result Honestly
A sensible reading of a first score sounds like this: it is a rough reference estimate of where you land, taken through your particular device, on that particular day. It is not a ranking, not a diagnosis, and not fixed. Results vary from session to session for everyone.
A score on a phone touchscreen never feels identical to a mouse score, and the numbers back that up — so resist comparing your result against a friend's unless you both tested on similar hardware. The comparison that actually means something is you against yourself, same setup, across multiple sessions.
What to Do Next
The most useful next step is simply a second and third session on different days, using the same device and browser each time. Three medians tell you far more than one ever could, and they usually settle into a range that feels like your genuine level.
If you want a longer series in one sitting, our 10-round reaction speed test gives the median more data to work with. Whatever mode you choose, keep the conditions boring: quiet room, similar time of day, no second screen. Consistency is what turns a handful of scores into something you can actually interpret.
FAQ
Is my first reaction test score accurate?
It is real, but it is not representative. First sessions carry a learning cost, and one session cannot capture day-to-day variation in sleep, attention, and fatigue. Treat your first result as a starting estimate and refine it with a few more sessions.
What is a normal reaction time for an online test?
For browser-based testing, the closest published reference point is a web sample of over 10,000 people with a median of 301 ms. Somewhere in the 250–350 ms band is very typical for an online test; lab numbers like 231 ms come from calibrated hardware and are not directly comparable.
Why was my very first round so much slower than the rest?
Part of that round is spent learning the task rather than reacting to it — recognizing the signal, calibrating your timing, settling your hand. This is a near-universal pattern, and it is one reason multi-round tests report a median rather than a single attempt.
Is a score under 100 ms possible?
Not as a genuine reaction on a browser test. A 60 Hz display alone redraws every 16.7 ms, and input and browser latency add more on top of human response time. A sub-100 ms reading almost always means the click anticipated the signal rather than followed it.
Should I test on my phone or my computer?
Pick whichever you will use consistently, and stay with it. Touchscreens and mice have different input latency, so scores across devices are not comparable. For tracking yourself over time, one device under stable conditions beats switching back and forth.
Sources
- Woods et al. (2015), Frontiers in Human Neuroscience — calibrated lab simple visual RT in 1,469 adults, including the Vincent et al. and Deary & Der figures cited via its Table 1.
- Web-based reaction time sample (2020), Frontiers in Aging Neuroscience — median 301 ms across 10,060 online participants.
- Wilkinson and Allison (1989) — age-decade reaction time differences in 5,325 participants.
- Van Dongen et al. (2003), Sleep — dose-dependent effects of sleep restriction on attention and performance.
- Dye, Green & Bavelier (2009) — action video game players respond faster without losing accuracy.

Mikasa writes the timer code, reads the primary research, and checks every published claim against it — the same standard described in our editorial policy.
This article is educational, not medical or safety advice. Claims are reviewed against the linked sources and our editorial policy.
Launch the reaction time test
Five rounds, random delays, median score — run it on this device and start your own baseline today.
Start the five-round test