Online Reaction Test Compare Results
You took a reaction test last week and scored 285 ms. Today you scored 240 ms. Did you actually get faster, or is something else going on? This question — how to compare reaction test results without fooling yourself — is the most useful skill an online test can teach you, and it is what this guide covers.
Overview
You took a reaction test last week and scored 285 ms. Today you scored 240 ms. Did you actually get faster, or is something else going on? This question — how to compare reaction test results without fooling yourself — is the most useful skill an online test can teach you, and it is what this guide covers.
The short version: a fair comparison requires the same device, the same conditions, and more than one data point on each side. Almost everything people get wrong about reaction test scores comes from breaking one of those rules. Below we walk through session-to-session comparison, why person-to-person comparison usually fails, and how to read the spread between your own sessions honestly.
Why Most Reaction Test Comparisons Are Unfair
Every online reaction score is a bundle of things: your nervous system, your display, your input hardware, your browser, and your mental state at that moment. A standard 60 Hz screen redraws every 16.7 milliseconds or so, which means the signal can sit waiting for the next frame before you ever see it. Touchscreens and mice add their own delays on top.
Because of this, two scores are only meaningfully comparable when everything except the person is held constant. Change the device, the time of day, or even the chair you are sitting in, and you have introduced a new variable. The score did not change — the measurement did.
Published research shows how much the setup matters. Calibrated laboratory work by Woods et al. (2015) put mean simple visual reaction time near 231 ms in 1,469 adults, while a web-based sample of 10,060 people — closer to how you are testing right now — reported a median of 301 ms. Same human reflexes, different instruments, different numbers.
Comparing Session to Session: The Rules
The one comparison that genuinely works is you against yourself, across sessions, under controlled conditions. Think of each session as a small experiment where you hold every variable steady except the one you care about — usually time, and with it, your underlying consistency or improvement.
In practice, that means building a personal protocol and sticking to it:
- Same device, same browser, same input — a phone score and a mouse score live on different scales.
- Similar time of day, so fatigue and daily rhythm do not confound the comparison.
- Same test mode — a simple five-round session, a ten-round session, and a choice-color task measure different things.
- Quiet, distraction-free surroundings for every session you plan to compare.
- The full round count every time, with the median recorded as your session result.
Running this site, we notice that people who follow a fixed protocol stop arguing with their scores within a week or two. The noise settles, and what remains is a number that actually means something. If you want the details of how the timer and median work on our five-round test, the methodology page lays them out.
Skip the guesswork — measure it
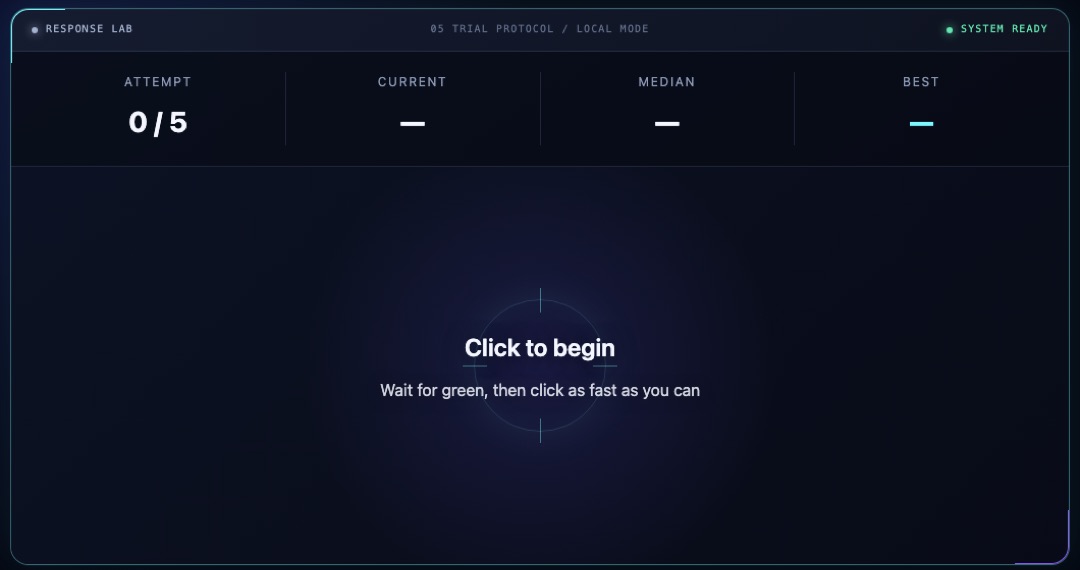
Reading about reaction time only gets you so far. The five-round test takes about a minute and gives you a median score you can actually track.
Take the reaction time testWhy Person-vs-Person Comparison Rarely Works
Comparing your 260 ms against a friend's 230 ms feels natural, but it usually tells you nothing. Unless you both tested on the same device, in the same session, with the same mode, you are comparing two bundles of hardware and circumstance — not two nervous systems.
Even with identical setups, person-to-person comparison runs into a deeper problem: people differ for reasons that have nothing to do with effort or worth. Age shifts reaction time gradually — in the Woods et al. data, observed means moved from roughly 218 ms in the youngest adults to about 239 ms in the oldest, and Wilkinson and Allison (1989) found a similar decade-by-decade pattern across 5,325 participants. Sleep history matters too: Van Dongen et al. (2003) showed that cumulative sleep restriction degrades sustained attention and cognitive performance in a dose-dependent way.
Practice background adds another layer. Dye, Green and Bavelier (2009) found that action video game players respond faster without sacrificing accuracy — so the friend beating you may simply have logged thousands of hours of relevant practice. Raw scores between individuals mix biology, history, and hardware in proportions nobody can untangle from a single number.
What the Spread Between Your Sessions Tells You
Once you test under consistent conditions, your session medians will still move around — and that movement is information. A spread of roughly 20–40 ms between sessions, on the same setup, is ordinary human variation. Attention, alertness, and small differences in readiness all nudge the number.
A single outlier session means very little. Test late at night after a short night's sleep and you will likely see a slower median; that is your state, not your trait. What deserves attention is a shift that persists across several sessions — a new level that holds for a week or more. That is the signature of a real change, whether it comes from better sleep habits, more practice, or simply learning to focus on the task.
The pattern of the spread matters as much as its size. A quick reading guide:
- Wild swings between sessions — inconsistent conditions or attention; tighten your protocol first.
- Tight clustering around one level — a stable setup whose results you can trust.
- A one-off slow session — your state on the day, not your trait.
- A new level holding for a week or more — a real change, from better sleep, practice, or sharper focus.
Treat the spread as a quality check on your own testing discipline before you read anything into the level itself.
Using Medians and Trends for an Honest Comparison
The honest unit of comparison is the session median, not the single best round. One fast click can be luck or anticipation — any browser score under about 100 ms is anticipation rather than reaction, since the visual and motor loop simply cannot run that fast. The median filters out both lucky rounds and distracted ones, leaving the center of your actual performance.
Across sessions, compare trends rather than individual results. Three to five medians under your fixed protocol give you a baseline you can defend. A downward drift over weeks means something real is improving; a steady line is itself a meaningful result.
One caution applies when you switch test modes. Our ten-round reaction speed test smooths out more noise than five rounds, the choice-color reflex test adds a decision step that naturally lengthens times, and the F1 lights-out test punishes anticipation with jump-start faults. Scores across these modes are not interchangeable — compare within a mode, never across modes.
FAQ
How much variation between sessions is normal?
On a fixed setup, session medians commonly move by 20–40 ms in either direction due to ordinary fluctuations in attention and alertness. Only a shift that persists across several sessions signals a real change. A single slow session — after poor sleep or a distracted day — is best discarded from your mental average.
Can I compare my score with a friend's?
Only if you both test on the same device, in the same mode, under the same conditions — and even then, age, sleep history, and practice background all influence the numbers. As a rough bit of fun it is fine; as a verdict on who has faster reflexes, it is unreliable. Comparing your own sessions over time is far more informative.
Why is my score so different on my phone and my laptop?
Touchscreens, display refresh rates, and input hardware each add their own delay, and a 60 Hz screen alone quantizes timing into 16.7 ms steps. The two devices measure your biology through different equipment, so their scores sit on different scales. Pick one device for any comparison you care about.
Should I compare my best round or my median?
Always the median. A best round can reflect luck or anticipation — anything under about 100 ms on a browser test is anticipation, not reaction. The median of a full session represents your typical response and is the only number worth tracking.
How long should I track results before drawing conclusions?
Give it at least a handful of sessions spread over one to two weeks, all under your fixed protocol. With fewer data points, normal session-to-session spread can masquerade as improvement or decline. A trend across five or more medians is a much sturdier basis for any conclusion.
Sources
- Woods et al. (2015), Factors influencing the latency of simple reaction time — calibrated lab means, age gradient, protocol comparisons.
- Web-based reaction time sample (2020), Frontiers in Aging Neuroscience — median 301 ms across 10,060 online participants.
- Wilkinson and Allison (1989) — decade-by-decade age differences in 5,325 participants.
- Van Dongen et al. (2003), Sleep — cumulative sleep restriction degrades sustained attention.
- Dye, Green and Bavelier (2009) — action game players respond faster without accuracy loss.
- Best Reaction Test methodology — how the timer, median, and hardware limits work.

Mikasa writes the timer code, reads the primary research, and checks every published claim against it — the same standard described in our editorial policy.
This article is educational, not medical or safety advice. Claims are reviewed against the linked sources and our editorial policy.
Launch the reaction time test
Five rounds, random delays, median score — run it on this device and start your own baseline today.
Start the five-round test