Reaction Speed Test Online Leaderboard
Search for a reaction speed test online and you will find leaderboards everywhere: global rankings, daily top tens, hall-of-fame pages full of implausibly low numbers. They are fun to look at, and they tap into something real — once you have a score, you naturally want to know where you stand. The problem is that a leaderboard position on a browser-based reaction test says far less than it appears to say.
Overview
Search for a reaction speed test online and you will find leaderboards everywhere: global rankings, daily top tens, hall-of-fame pages full of implausibly low numbers. They are fun to look at, and they tap into something real — once you have a score, you naturally want to know where you stand. The problem is that a leaderboard position on a browser-based reaction test says far less than it appears to say.
This is not cynicism about competition. It is a measurement problem. Online scores bundle your biology together with your hardware, your display, and your behavior, and a public leaderboard cannot separate those layers. Here is what is actually being ranked, why the top of the table misleads, and what healthier ways to compete look like.
What an Online Leaderboard Actually Ranks
A leaderboard looks like a ranking of nervous systems. It is really a ranking of sessions — one person, on one device, in one moment, clicking at one signal. Every entry mixes at least three ingredients: the player's genuine reaction speed, the latency of their entire hardware chain, and the degree to which they anticipated rather than reacted.
None of those ingredients is recorded or verified. The leaderboard sees a number and a name, nothing more. Two players with identical reflexes can land far apart for reasons that have nothing to do with biology — and two players with very different reflexes can land side by side for the same reason.
Device and Display Latency Skew Every Score
Start with the physics every online score contains. A standard 60 Hz screen redraws every ~16.7 ms, so the signal can sit on screen for up to a full frame before you see it. Display response time, input polling, the operating system, and the browser each add their own delay on top. Your measured time is your biology plus your setup.
That extra latency is not equal across players. Someone on a high-refresh monitor with a wired mouse is playing a different instrument than someone tapping a phone — even with identical nervous systems. A leaderboard that mixes these setups is comparing equipment as much as people.
- Display refresh — a 60 Hz panel quantizes the signal into ~16.7 ms frames.
- Input path — wired mouse, Bluetooth mouse, and touchscreen report clicks on different schedules.
- Software stack — browser, operating system, and background load add variable delay.
- Network and tab state — none of it visible to the leaderboard, all of it landing in the score.
This is why browser scores should never be read as lab numbers. In calibrated laboratory conditions, the mean simple visual reaction time across 1,469 adults was about 231 ms in the 2015 study by Woods and colleagues. A web-based sample of 10,060 people — the setup closest to an online leaderboard — reported a median of 301 ms. The gap is mostly hardware and protocol, not a slower population. Our methodology page explains the details.
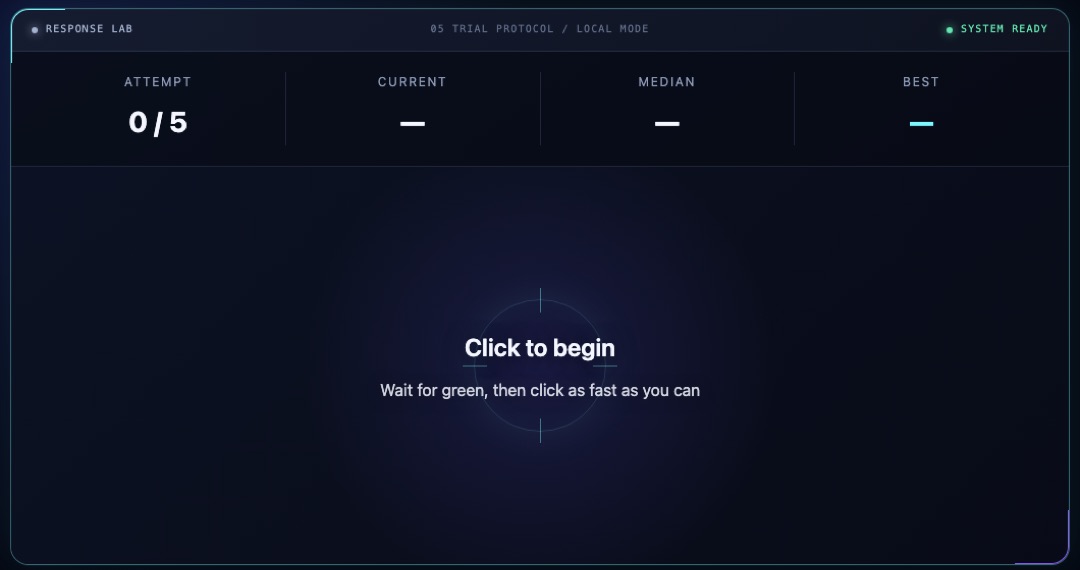
Skip the guesswork — measure it
Reading about reaction time only gets you so far. The five-round test takes about a minute and gives you a median score you can actually track.
Take the reaction time testLeaderboards Reward Anticipation, Not Reaction
The deeper distortion is behavioral. The signal arrives after a random delay precisely so you cannot predict it — but a player who clicks early and guesses right records a spectacular time. Guess wrong, a false start; guess right, a trophy.
Over enough attempts, the leaderboard becomes a lottery: a player retrying a hundred times with aggressive timing will eventually post a number no honest reactor can match. As a rule of thumb, scores under roughly 100 ms on a browser test indicate anticipation, not reaction — human visual reaction time plus display latency does not get near that low.
Running this site, we see the pattern plainly: a player's first round is almost always the slowest, and after a long streak of rounds, timing gets erratic as some players start leaning into prediction. A good test flags those rounds — our five-round reaction test treats too-early clicks as false starts — but a leaderboard of raw single attempts cannot.
The Conditions Behind Top Scores Are Unverifiable
Even setting hardware and anticipation aside, nobody audits a leaderboard entry. You do not know whether the number above you came from a well-rested player in a quiet room or from a ninetieth attempt at 2 a.m.
State matters. Van Dongen and colleagues (2003) showed that cumulative sleep restriction degrades sustained attention dose-dependently — and attention is exactly what a reaction test draws on. Age shifts things gently: in the Woods et al. data, observed means rose from roughly 218 ms in the youngest adults to about 239 ms in the oldest, and Wilkinson and Allison found a similar pattern across 5,325 participants. Our average reaction time page lays out these reference estimates.
A single global ranking flattens all of this into one column of numbers. It cannot tell you who was fresh, who was guessing, or whose monitor was fast. Treat it as entertainment, not evidence.
What a Leaderboard Position Does and Doesn't Say
A leaderboard position is narrow, not meaningless. A high rank does tell you the player was engaged, practiced the task, and produced a fast session on their setup — and consistency across many sessions is genuinely harder to fake than one low number.
What it does not tell you is bigger. It does not rank raw biological reaction speed, and it does not transfer across devices — most people find a phone touchscreen score never matches a mouse score, and the numbers agree. It predicts nothing elsewhere and says nothing about health.
The honest summary: a leaderboard ranks scores, and scores are part biology, part equipment, part behavior. Only the first of those is really about you.
Healthier Ways to Compete
If you enjoy the competitive itch — and most people do — there are better ways to scratch it than chasing a global table. The trick is to compete on terms where the comparison is actually fair:
- Track your own trend. Your median over weeks, on the same device, is the one ranking where every confound is held constant — a longer format like our 10-round reaction speed test gives a steadier baseline.
- Duel a friend on one device. Alternate rounds on the same laptop or phone, in the same session — now the comparison means something.
- Compete on consistency, not best click. Compare session medians rather than single lucky rounds.
- Change the task, not the stakes. A choice-mode or lights-out format tests a different skill without pretending to crown a champion.
- Retire the number. When your trend plateaus, that is information about habits, not a verdict on your reflexes.
Personal trends beat public rankings for one reason: they control the variables a leaderboard cannot. Same person, same device, same protocol — the differences you see finally belong to you.
FAQ
Are online reaction-time leaderboards fake?
Not fake — unverifiable. Most entries are real clicks, but the leaderboard cannot show the hardware latency, anticipation, fatigue, or retry count behind each number, so the ranking blends all of it and presents the mix as pure reflex.
Why do some leaderboard scores look impossibly low?
Usually anticipation. A guess-timed click occasionally lands right after the signal, producing a time no genuine reaction can reach. Scores under roughly 100 ms on a browser test are best read as lucky predictions — display latency alone makes true scores that low implausible.
Is a 60 Hz screen really a disadvantage?
Yes, and it is physics. A 60 Hz display redraws every ~16.7 ms, so the signal can wait up to a full frame before appearing. Higher-refresh panels shrink that window, so two equally fast players on different screens post different numbers.
Do some people genuinely have faster reactions than others?
They do, within limits. Study means range from 231 ms in calibrated labs to a 301 ms median in web-based samples, and Dye, Green and Bavelier (2009) found action video game players respond faster without losing accuracy. But differences of this size vanish on a leaderboard, where hardware and guessing create far larger swings.
What is the fairest way to compare reaction times with friends?
Use one device, one browser, alternating rounds in the same sitting, and compare session medians rather than single best clicks. That removes equipment and condition differences, which are the biggest sources of distortion in any online comparison.
Sources
- Woods et al. (2015), Frontiers in Human Neuroscience — lab mean ~231 ms (N=1,469); age gradient; protocol table.
- Web-based sample (2020), Frontiers in Aging Neuroscience — online median 301 ms, N=10,060.
- Wilkinson & Allison (1989) — decade-by-decade age differences, N=5,325.
- Van Dongen et al. (2003), Sleep — sleep restriction degrades attention dose-dependently.
- Dye, Green & Bavelier (2009) — action gamers respond faster without losing accuracy.

Mikasa writes the timer code, reads the primary research, and checks every published claim against it — the same standard described in our editorial policy.
This article is educational, not medical or safety advice. Claims are reviewed against the linked sources and our editorial policy.
Launch the reaction time test
Five rounds, random delays, median score — run it on this device and start your own baseline today.
Start the five-round test